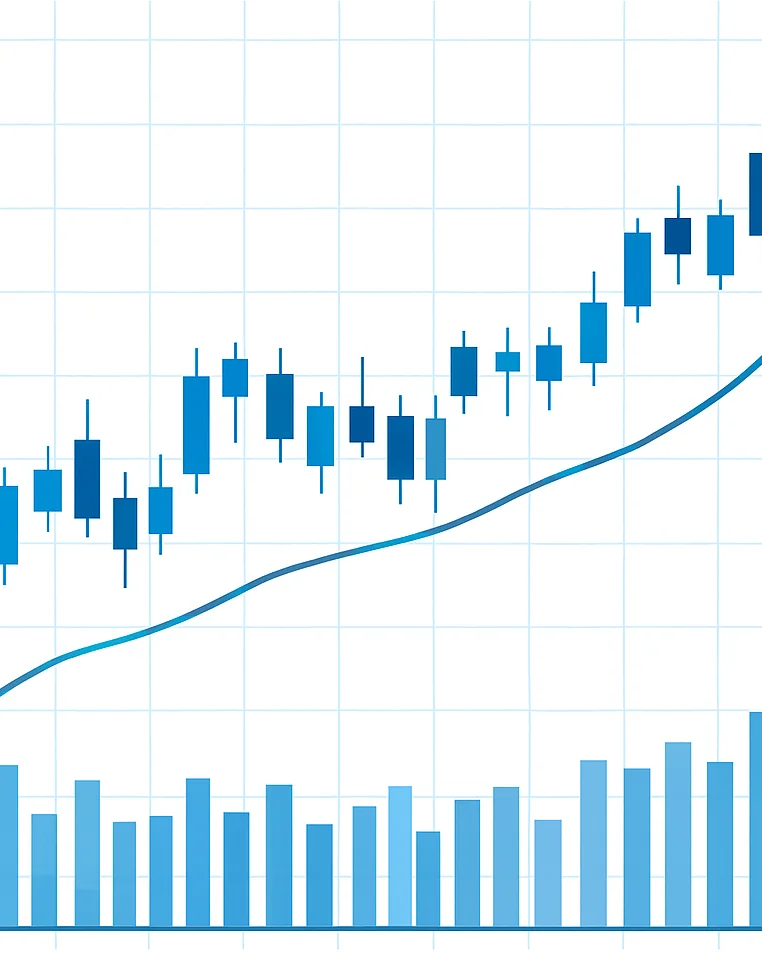
Our YouTube channel walks through live stock charts and historical moves frame by frame. Each video reinforces the written lessons, so you can see candlesticks, moving averages, and volume bars working together in plain language.
Anatomy of candles, body and wick reading, and how single bars build into larger price stories.
Trendline Construction
Drawing trendlines from swing points, testing their reliability, and reading what a break does to the trend.
Market Structure Analysis
Identifying higher highs and lower lows, and how structure shifts across timeframes in real charts.
Visual method
Every video shows the chart, not just the claim
In each review we pause on the chart, mark the candles, draw the trendline, and point to the volume bars that confirm or question a move. The method is the same whether the chart is from today or from a past market cycle.
Subscribe on YouTube to follow new walkthroughs as they are published.