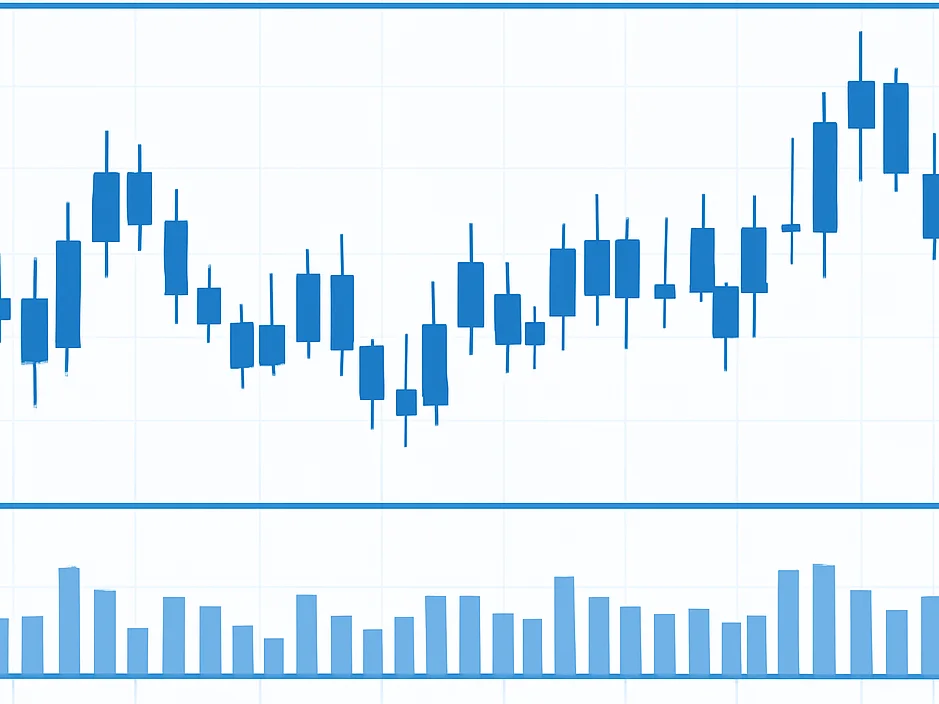
Structured technical breakdowns of index structures, sector rotations, and volume profiles, with the chart evidence shown for each reading.
Core breakdowns
Reading structure, momentum, and alignment
Consolidation ranges
Where price is balancing
A consolidation range shows where buyers and sellers have been contesting value. We mark its boundaries, note how volume behaved inside it, and explain what a clean break or failed break would look like on the chart.
Trend momentum
How strong is the move
Momentum reads the pace of a move rather than its direction alone. We compare swing lengths and the spacing of higher highs or lower lows to judge whether the trend is gathering energy or losing it.
Multi-timeframe alignment
Checking the same story twice
A pattern on a daily chart carries different weight when the weekly chart agrees. We compare timeframes side by side to see whether the structure is consistent or whether a shorter move is simply noise inside a larger one.
Case study frameworks
Entry, invalidation, and target
Each framework lays out the chart levels that defined the setup, the conditions that would invalidate it, and the price zones the analysis measured. Confirming and failed setups are both included.
Entry criteria
Defining the trigger
We record the exact candle close, level, or trendline interaction that qualified the setup, so the reader can see what was required before the idea was valid.
Invalidation levels
Where the idea breaks
Every case marks the price level that would prove the reading wrong. Showing the invalidation point keeps the analysis honest and makes risk visible on the chart.
Price targets
Measured zones, not promises
Targets are drawn from prior swing highs, measured moves, and volume nodes. They describe where the chart has previously reacted, not where price is guaranteed to travel.